Time for Stock Picking?
June 27, 2024

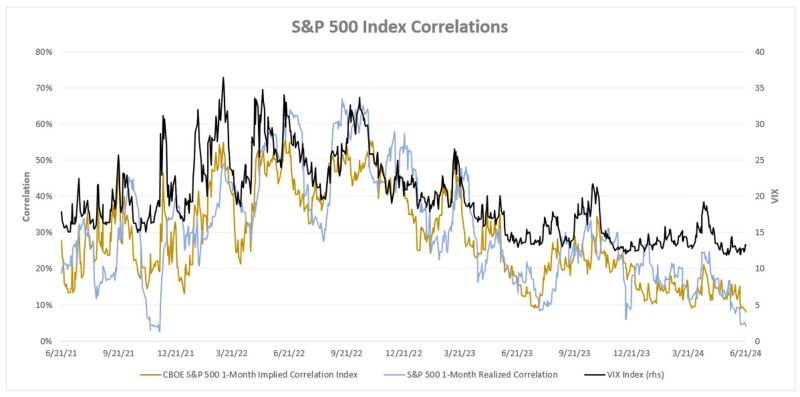
As of June 21, 2024, the Chicago Board Options Exchange (CBOE) S&P 500 1-Month Implied Correlation Index has reached new lows since the COVID-19 pandemic. This index is calculated based on options data of the S&P 500 Index and its individual constituents. High implied correlation indicates that investors expect S&P 500 Index stocks’ prices will likely move in the same direction, and low implied correlation indicates they will likely go separate ways. Why has this occurred, and what does it entail?
There are both macroeconomic (macro) and microeconomic drivers for low correlations. Macro uncertainty appears to be receding this year as inflation is gradually moving toward the Federal Reserve's (Fed) 2% target, and labor market supply and demand have rebalanced to pre-pandemic levels. Both were achieved without a significant economic slowdown. In addition, the Fed is unlikely to hike interest rates further and shows a willingness to ease monetary policy once conditions allow. As a result, the ICE Bank of America Move Index, a barometer for macro volatility, is retreating to levels witnessed before the Fed's rate-hiking cycle.1 During periods of significant macro influence, such as the COVID-19 pandemic or periods of elevated inflation, stocks tend to move more in sync. A benign macro environment allows stocks to be driven by more individual fundamentals, and it appears stocks have embraced that freedom.
Year-to-date (as of 6/21/24) price return for the S&P 500 Index is 14.6%;2 however, there is a significant performance divergence among constituents. Gains are concentrated within mega-cap and artificial intelligence-related stocks. The S&P 500 Equal Weighted Index, which includes the same constituents as the S&P 500 Index but is equally weighted to remove the size bias, has returned only 4.5% for the same period.3 As seen in today’s chart, the S&P 500 1-Month realized correlation is near its lowest level in the past three years — and investors believe this dynamic will continue.
The low correlations might bring opportunities for some investors, as significant stock performance divergence may present ample alpha generation opportunities. Performance for actively managed funds have not been satisfying, but they have shown some progress this year. According to Goldman Sachs, 45% of U.S. large-cap mutual funds are outperforming their benchmarks in 2024, compared to the historical average of 38%.4
Additionally, low correlations can be beneficial to market participants who utilize S&P 500 Index options to manage market risk. Low correlation is typically accompanied with low implied volatility. As displayed in today’s chart, the CBOE Volatility Index (VIX) is also near its lowest level post-pandemic. For hedgers, low implied volatility may offer solutions, incorporating S&P 500 Index options, with predictable and reasonable hedging cost.
Key Takeaway
The CBOE S&P 500 1-Month Implied Correlation Index has hit new lows since the COVID-19 pandemic, driven by receding macro risks and diverging individual stock performance. In my opinion, this environment may be favorable for experienced stock pickers and risk hedgers who utilize S&P 500 Index options. Nevertheless, a combination of high valuations and low correlation has historically suggested potential downside risk for stocks.5
Sources:
1-3Bloomberg
4Goldman Sachs – Pro-cyclical tilt drives strong YTD mutual fund performance; 5/24/24
5Bloomberg – ‘Dangerous’ Pair of Valuation, Correlation Threatening Stocks; 8/6/2018
This material is for informational use only. The views expressed are those of the author, and do not necessarily reflect the views of Penn Mutual Asset Management. This material is not intended to be relied upon as a forecast, research or investment advice, and it is not a recommendation, offer or solicitation to buy or sell any securities or to adopt any investment strategy.
Opinions and statements of financial market trends that are based on current market conditions constitute judgment of the author and are subject to change without notice. The information and opinions contained in this material are derived from sources deemed to be reliable but should not be assumed to be accurate or complete. Statements that reflect projections or expectations of future financial or economic performance of the markets may be considered forward-looking statements. Actual results may differ significantly. Any forecasts contained in this material are based on various estimates and assumptions, and there can be no assurance that such estimates or assumptions will prove accurate.
Investing involves risk, including possible loss of principal. Past performance is no guarantee of future results. All information referenced in preparation of this material has been obtained from sources believed to be reliable, but accuracy and completeness are not guaranteed. There is no representation or warranty as to the accuracy of the information and Penn Mutual Asset Management shall have no liability for decisions based upon such information.
High-Yield bonds are subject to greater fluctuations in value and risk of loss of income and principal. Investing in higher yielding, lower rated corporate bonds have a greater risk of price fluctuations and loss of principal and income than U.S. Treasury bonds and bills. Government securities offer a higher degree of safety and are guaranteed as to the timely payment of principal and interest if held to maturity.
All trademarks are the property of their respective owners. This material may not be reproduced in whole or in part in any form, or referred to in any other publication, without express written permission.

