Volatility Markets Show Signs of Panic
August 8, 2024

Over the course of the last few trading days, the market has turned sharply risk off. A busy calendar of macroeconomic data last week jump-started the sharp change in tone regarding risk assets. On the macroeconomic side, weaker-than-anticipated manufacturing data was the first shoe to drop. Later in the week, a weaker-than-expected nonfarm payroll report led investors to rethink the soft landing narrative that had led to strong momentum for risk assets all year. As of August 5, the market is pricing the Federal Reserve to cut interest rates 4.5 times by the end of the year, compared to 2.6 cuts just a week earlier.1 In the three trading days since the Institute for Supply Management (ISM) Manufacturing Purchasing Managers’ Index miss on August 1, the S&P 500 Index (SPX) has traded down 4.7%, while the 10-year Treasury rate has decreased by 19 basis points (bps).2
The volatility market has not missed out on the fireworks. Throughout 2024, implied volatility on the SPX has remained very low compared to history. This has mostly been due to low realized volatility on the index. On the strength of the soft landing narrative, the equity market demonstrated strong momentum, continuing to grind higher all year. The Chicago Board Options Exchange Volatility Index (VIX) — a measure of the implied volatility on 1-month SPX options — has averaged 14.17 in 2024, compared to its 5-year average of 21.18.3 On August 5, the VIX briefly reached 65 and closed at 38.51.4
Another way of gauging the equity market through a volatility lens is to examine the skew present in the implied volatility surface. Skew is a measure of the difference in volatility being charged between an out of the money option and an at the money option. Typically, out of the money puts trade at a higher volatility than at the money options. The reason for this is twofold. Demand for hedges tends to create natural buyers of out of the money puts, which drives up the price of these options. Out of the money puts are also protection against sharp selloffs in the market, where volatility tends to be higher than in more calm environments. This dynamic raises the amount of volatility that is priced in when trading these out of the money puts.
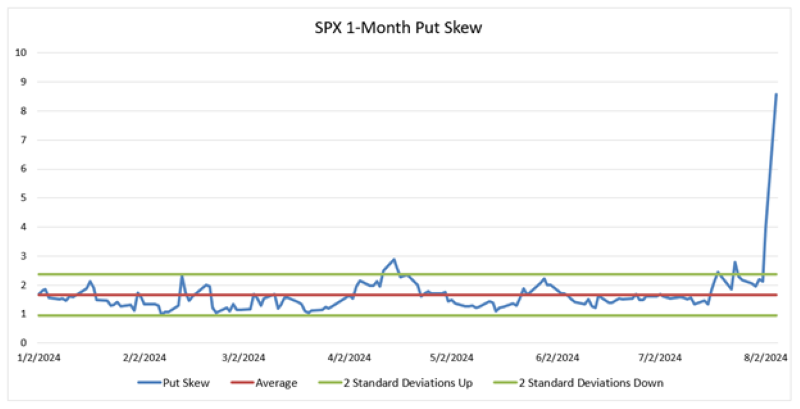
Today’s Chart of the Week shows the 1-month put skew for SPX options throughout 2024. For the most part, it has been very flat. So far in 2024, out of the money puts have traded an average of 1.67 points higher than the at the money in implied volatility terms. This compares to a 5-year average of 3.81 points. This flat downside skew speaks to the complacency seen from investors as the market continued to move upward this year. Flat skew is a result of either little demand for options to hedge downside risks, or the willingness of investors to sell these options and depress the implied volatility. However, over the last three trading days, we have seen put skew take an elevator ride up. The implied volatility for short dated out of the money puts has quickly exploded as investors have reached for protection in the recent risk-off move.
Key Takeaway
Throughout 2024, the SPX options market exhibited calmness alongside its underlying index. For the most part, downside protection has been offered at cheap levels relative to where it typically trades historically. Over the last few days, we have been reminded that risk-off moves happen quickly and can come from seemingly out of nowhere. When the market offers up cheap protection, especially in highly convex instruments like options, it may benefit greatly to utilize them.
Sources:
1-4Bloomberg
This material is for informational use only. The views expressed are those of the author, and do not necessarily reflect the views of Penn Mutual Asset Management. This material is not intended to be relied upon as a forecast, research or investment advice, and it is not a recommendation, offer or solicitation to buy or sell any securities or to adopt any investment strategy.
Opinions and statements of financial market trends that are based on current market conditions constitute judgment of the author and are subject to change without notice. The information and opinions contained in this material are derived from sources deemed to be reliable but should not be assumed to be accurate or complete. Statements that reflect projections or expectations of future financial or economic performance of the markets may be considered forward-looking statements. Actual results may differ significantly. Any forecasts contained in this material are based on various estimates and assumptions, and there can be no assurance that such estimates or assumptions will prove accurate.
Investing involves risk, including possible loss of principal. Past performance is no guarantee of future results. All information referenced in preparation of this material has been obtained from sources believed to be reliable, but accuracy and completeness are not guaranteed. There is no representation or warranty as to the accuracy of the information and Penn Mutual Asset Management shall have no liability for decisions based upon such information.
High-Yield bonds are subject to greater fluctuations in value and risk of loss of income and principal. Investing in higher yielding, lower rated corporate bonds have a greater risk of price fluctuations and loss of principal and income than U.S. Treasury bonds and bills. Government securities offer a higher degree of safety and are guaranteed as to the timely payment of principal and interest if held to maturity.
All trademarks are the property of their respective owners. This material may not be reproduced in whole or in part in any form, or referred to in any other publication, without express written permission.
