Why So (Interest Rate) Sensitive?
January 16, 2025

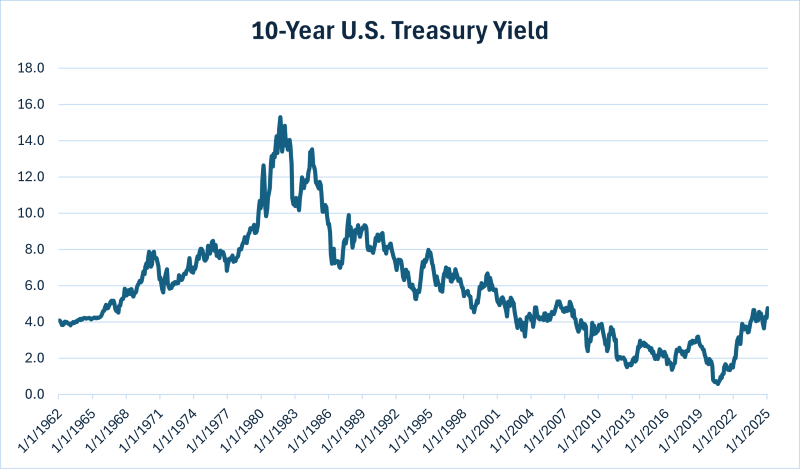
I’m not sure if there is a more important chart than today’s Chart of the Week — a long-term chart of the 10-year U.S. Treasury yield. Long-term trends can be important to technical analysts and other market observers, and arguably, no other market data is as closely followed as this global benchmark.
For 40 years, from the early 1980s to the early 2020s, the 10-year yield declined from a peak of 15.3% in 1981 to a remarkable trough of 0.4% during the depths of the COVID-19 pandemic.1
In general, the stock market has done very well over this entire period, even as interest rates have normalized, and regained levels not seen since before the Global Financial Crisis of 2008-2009.
More recently, though, over the past three years, we have noticed that as the rate environment shifts up to a more normal level, the stock market has been more sensitive to sharp moves in the 10-year yield — for better (when rates decline) or for worse (when rates rise). Case in point, the strong relief rally after yesterday’s consumer price index (CPI) report (in line expectations, not worse than feared) led to a significant decline in Treasury yields and a surge in stocks and other risk assets.2 The reverse of course has also been true as asset prices have tumbled when rates have increased sharply. For example:
- In 2022, from January 1 to October 21, the 10-year yield quickly shifted from 1.5% to 4.2%, and the S&P 500 Index declined by 21.3% over this period.3
- In late 2023, from July 28 to October 20, the 10-year yield rose from slightly under 4.0% to approximately 5.0%, while the S&P 500 Index dropped by 7.8%.4
Today, roughly over the trailing month, from December 6, 2024 to January 10, 2025, the 10-year yield jumped from approximately 4.2% to nearly 4.8%, resulting in a decline of 4.3% for the S&P 500 Index.5
At least in recent history, it appears clear that in a more normalized rate environment like we are in today, the velocity of the moves in yields is having an outsized, direct impact on the stock market. The post-presidential election move down in rates and surge in risk assets occurred this November— although it was brief. A resetting of inflation, economic growth and Federal Reserve (Fed) rate cut expectations has occurred. The job market continues to be stronger than expected, inflation remains above the Fed’s target and it appears more and more likely that the Fed may have overreacted with 100 basis points of cuts in 2024. With the markets, more cuts and lower rates are favored and these recent moves up and down in the 10-year yield challenged many assumptions as we embark upon a new administration — an administration that has an intent to set more growth-related policies. What will these policies do for growth and inflation? More importantly, what will that mean for rates and stocks moving forward?
Key Takeaway
I believe this interest rate sensitivity dynamic is the most important issue we should keep an eye on for 2025 and beyond. As an investor, I do not know where rates are headed, up or down, but it is very important to be aware of what is driving markets and what risks and opportunities may lie ahead as we navigate these factors.
Sources:
1, 3-5Bloomberg
2CNBC – Dow rallies 500 points after encouraging inflation report, strong bank earnings: Live updates; 1/15/25
This material is for informational use only. The views expressed are those of the author, and do not necessarily reflect the views of Penn Mutual Asset Management. This material is not intended to be relied upon as a forecast, research or investment advice, and it is not a recommendation, offer or solicitation to buy or sell any securities or to adopt any investment strategy.
Opinions and statements of financial market trends that are based on current market conditions constitute judgment of the author and are subject to change without notice. The information and opinions contained in this material are derived from sources deemed to be reliable but should not be assumed to be accurate or complete. Statements that reflect projections or expectations of future financial or economic performance of the markets may be considered forward-looking statements. Actual results may differ significantly. Any forecasts contained in this material are based on various estimates and assumptions, and there can be no assurance that such estimates or assumptions will prove accurate.
Investing involves risk, including possible loss of principal. Past performance is no guarantee of future results. All information referenced in preparation of this material has been obtained from sources believed to be reliable, but accuracy and completeness are not guaranteed. There is no representation or warranty as to the accuracy of the information and Penn Mutual Asset Management shall have no liability for decisions based upon such information.
High-Yield bonds are subject to greater fluctuations in value and risk of loss of income and principal. Investing in higher yielding, lower rated corporate bonds have a greater risk of price fluctuations and loss of principal and income than U.S. Treasury bonds and bills. Government securities offer a higher degree of safety and are guaranteed as to the timely payment of principal and interest if held to maturity.
All trademarks are the property of their respective owners. This material may not be reproduced in whole or in part in any form, or referred to in any other publication, without express written permission.
