Volatility Strikes Back
April 3, 2025

So far in 2025, implied volatility has reset to levels higher than those experienced in 2024. Last year, the fundamental macro picture was mostly benign, with the Goldilocks narrative allowing equities to drift upward thereby keeping realized volatility low while capping implied volatility.
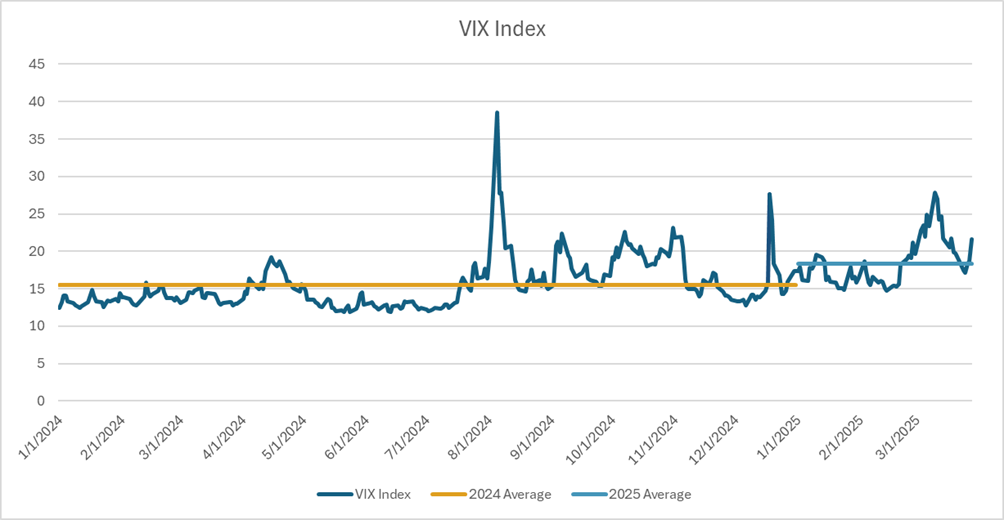
On the technical side, low demand for put options depressed skew on the S&P 500 Index (SPX), which led to lower values of the Chicago Board Options Exchange Volatility Index (VIX). Over the first three months of this year, both phenomena have reversed. As evidenced in today’s Chart of the Week, the VIX is averaging 2.9 points higher than it did last year. The VIX is calculated similarly to a derivative known as a variance swap. The calculation involves taking a weighted average of all available SPX options in the market with roughly 30 days to maturity where the weight is the inverse of the option strike squared. Due to this weighting, out-of-the-money puts have a proportionally larger impact on the level of the VIX than out-of the-money calls.
This makes skew, how much higher the implied volatility of out-of-the-money puts is compared to out-of-the-money calls, an important driver of the VIX. When demand for downside protection grows and skew steepens, the VIX tends to rise. In 2024, investors chased upside in the options market, flattening the skew. This translated to lower VIX levels, as concern for equity downside was not being heavily priced in. In 2025, that trend has reversed. Skew has steepened, helping to put a higher floor on the VIX as investors buy short-term equity downside protection. As evidence, consider the difference between the VIX and 1-month at-the-money implied volatility. So far in 2025, this spread is 0.43 points higher than it was in 2024.1
Also fueling this reset higher in implied volatility is the general headline volatility we have witnessed this year. Daily news around government policy has led to a stock market that can swing at a moment’s notice. Tariff implementation has been top of mind for investors over the first few months of the year. The post-election optimism around deregulation and tax cuts fueling economic growth has faded as the pain tolerance for the Trump administration seems to be higher than most thought, with growth negative and inflationary policies being front-loaded. This policy uncertainty has started to weigh on consumer sentiment. Worse still, recent retail sales and personal spending data suggest consumers may be starting to pull back. Concern around economic growth has led the SPX to decline by 5.1% in 2025, as of March 28.2 This decline, in turn, has helped drive implied volatility higher, as market sell-offs typically spark upward moves in volatility.
Key Takeaway
Implied volatility has traded higher this year for both technical and fundamental reasons. One lens for viewing this is through the level of the VIX. On average in 2025, the VIX has implied roughly 18 basis points of additional daily equity movement compared to 2024.3
This has happened due to what could be seen as a circular feedback loop: Volatility around federal government policy has caused investors to worry about a growth slowdown. These sell-offs, along with intermittent relief rallies on positive tariff news, have caused implied volatility to rise as the market adjusts to larger daily swings.
At the same time, declining sentiment around the U.S. market has driven demand for downside protection, causing skew to steepen and further lifting the VIX. Since this feedback loop shows no signs of ending, I expect implied volatility to have a higher floor this year than we saw during the previous few years of trading under the Goldilocks macro narrative.
Sources:
1-3Bloomberg
This material is for informational use only. The views expressed are those of the author, and do not necessarily reflect the views of Penn Mutual Asset Management. This material is not intended to be relied upon as a forecast, research or investment advice, and it is not a recommendation, offer or solicitation to buy or sell any securities or to adopt any investment strategy.
Opinions and statements of financial market trends that are based on current market conditions constitute judgment of the author and are subject to change without notice. The information and opinions contained in this material are derived from sources deemed to be reliable but should not be assumed to be accurate or complete. Statements that reflect projections or expectations of future financial or economic performance of the markets may be considered forward-looking statements. Actual results may differ significantly. Any forecasts contained in this material are based on various estimates and assumptions, and there can be no assurance that such estimates or assumptions will prove accurate.
Investing involves risk, including possible loss of principal. Past performance is no guarantee of future results. All information referenced in preparation of this material has been obtained from sources believed to be reliable, but accuracy and completeness are not guaranteed. There is no representation or warranty as to the accuracy of the information and Penn Mutual Asset Management shall have no liability for decisions based upon such information.
High-Yield bonds are subject to greater fluctuations in value and risk of loss of income and principal. Investing in higher yielding, lower rated corporate bonds have a greater risk of price fluctuations and loss of principal and income than U.S. Treasury bonds and bills. Government securities offer a higher degree of safety and are guaranteed as to the timely payment of principal and interest if held to maturity.
All trademarks are the property of their respective owners. This material may not be reproduced in whole or in part in any form, or referred to in any other publication, without express written permission.

