Mid-Year Economic and Capital Markets Review & Outlook
July 17, 2024
.jpg "iStock-520329172_City Scapre Businessman Thinking resized (5).jpg")
Mid-Year Review
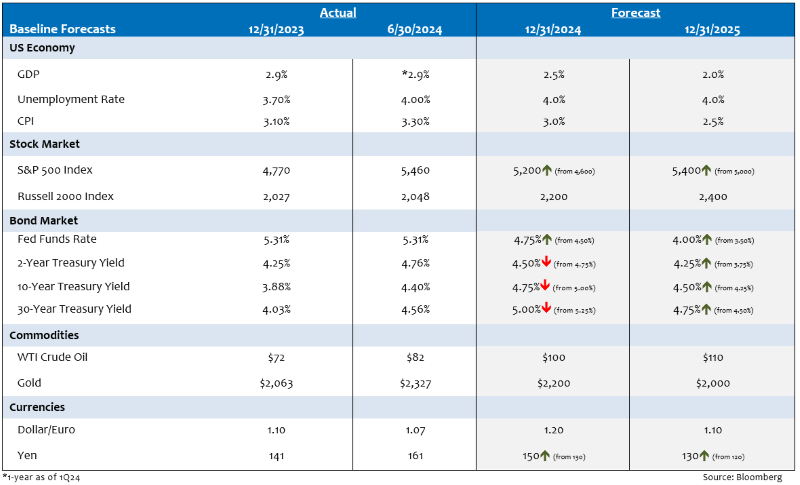
Resilience remained the operative word for U.S. economic and financial market conditions during the first half of 2024. Starting with the U.S. economy, growth moderated relative to the surprisingly robust pace witnessed in the second half of 2023, but there are a few signs an economic downturn is looming. Gross domestic product (GDP) for the first half of 2024 is projected to grow nearly 1.5%,1 a level suggesting the Federal Reserve (Fed) is on track to achieve the historically elusive economic “soft landing.” The powerful dynamic of full employment and strong household balance sheets continue to support the U.S. economic expansion.
The moderating growth environment was welcome news for Fed policymakers suggesting Fed rate cuts were likely this year. However, the same cannot be said for the disappointing news on inflation. Disinflationary trends that were in place entering the year reversed course as a string of higher-than-expected inflation prints forced Fed policymakers to postpone the start of interest rate cuts. The Fed’s favorite inflation gauge — core personal consumption expenditures (PCE) — increased to an annual rate of 3.7% during the first quarter,2 significantly above the Fed’s 2% goal. Fed Chair Powell labeled the higher inflation prints as “bumps in the road,”3 but better data on inflation is necessary for the Fed to follow through with at least one rate cut this year.
After moving sharply lower to close out 2023, Treasury yields followed inflation trends higher during the first half of 2024. The unexpected uptick in inflation coupled with the deluge of Treasury bond supply brought an abrupt end to the bond rally. The 10-year Treasury rate peaked at 4.70% in late April and finished the second quarter at 4.40%, up 52 basis points since the start of the year.4
Equity and credit markets took the backup in yields in stride, posting strong first-half results. The S&P 500 Index notched 33 record high closes during the first six months of the year,5 with large capitalization technology names continuing to lead the rally. Investor enthusiasm surrounding the potential of artificial intelligence (AI) more than outweighed any headwinds from higher interest rates.
Credit markets also benefited from abundant liquidity conditions and strong investor demand. Near record-high corporate bond issuance was easily absorbed by investors who took advantage of attractive all-in yield levels for fixed-income assets.
Outlook
The recent cooling of U.S. labor market conditions and inflation suggests Fed policymakers will likely start lowering short-term interest rates during the second half of the year. Abundant liquidity conditions, strong household balance sheets and the start of Fed easing are likely to keep economic growth in the solid but not spectacular category.
While the start of rate cuts would normally be welcome news for bond investors, the continuation of high budget deficits and record-high Treasury bond issuance may spell trouble for interest rates at the long end of the yield curve. In light of the deepening political polarization and growing election anxiety across the country, equity and credit market volatility is likely to pick up as the U.S. presidential election approaches.
For timely perspectives on the economy, markets and investing, be sure to subscribe to our market insights blog below.
Sources:
1The Conference Board – The Conference Board Economic Forecast for the US Economy; 7/11/24
2Bureau of Economic Analysis – Gross Domestic Product, First Quarter 2024; 4/25/24
3Federal Reserve Board – Transcript of Chair Powell’s Press Conference March 20, 2024
4U.S. Department of the Treasury – Daily Treasury Par Yield Curve Rates; as of 6/30/24
5Barron’s –The S&P 500 and Nasdaq close in record territory; 7/3/24
Index Definitions:
S&P 500 Index — An index of 500 stocks chosen for market size, liquidity and industry grouping, among other factors. The S&P 500 is designed to be a leading indicator of U.S. equities and is meant to reflect the risk/return characteristics of the large-cap universe.
Russell 2000 Index — An index measuring the performance of approximately 2,000 small-cap companies in the Russell 3000 Index, which is comprised of 3,000 of the largest U.S. stocks.
All trademarks are the property of their respective owners.
Disclosures:
The views expressed in this material are the views of PMAM through the year ending June 30, 2024, and are subject to change based on market and other conditions. This material contains certain views that may be deemed forward-looking statements. The inclusion of projections or forecasts should not be regarded as an indication that PMAM considers the forecasts to be reliable predictors of future events. Any forecasts contained in this material are based on various estimates and assumptions, and there can be no assurance that such estimates or assumptions will prove accurate. Actual results may differ significantly.
Past performance is not indicative of future results. The views expressed do not constitute investment advice and should not be construed as a recommendation to purchase or sell securities. All information has been obtained from sources believed to be reliable, but accuracy is not guaranteed. There is no representation or warranty as to the accuracy of the information and PMAM shall have no liability for decisions based upon such information.
This material is for informational use only. The views expressed are those of the author, and do not necessarily reflect the views of Penn Mutual Asset Management. This material is not intended to be relied upon as a forecast, research or investment advice, and it is not a recommendation, offer or solicitation to buy or sell any securities or to adopt any investment strategy.
Opinions and statements of financial market trends that are based on current market conditions constitute judgment of the author and are subject to change without notice. The information and opinions contained in this material are derived from sources deemed to be reliable but should not be assumed to be accurate or complete. Statements that reflect projections or expectations of future financial or economic performance of the markets may be considered forward-looking statements. Actual results may differ significantly. Any forecasts contained in this material are based on various estimates and assumptions, and there can be no assurance that such estimates or assumptions will prove accurate.
Investing involves risk, including possible loss of principal. Past performance is no guarantee of future results. All information referenced in preparation of this material has been obtained from sources believed to be reliable, but accuracy and completeness are not guaranteed. There is no representation or warranty as to the accuracy of the information and Penn Mutual Asset Management shall have no liability for decisions based upon such information.
High-Yield bonds are subject to greater fluctuations in value and risk of loss of income and principal. Investing in higher yielding, lower rated corporate bonds have a greater risk of price fluctuations and loss of principal and income than U.S. Treasury bonds and bills. Government securities offer a higher degree of safety and are guaranteed as to the timely payment of principal and interest if held to maturity.
All trademarks are the property of their respective owners. This material may not be reproduced in whole or in part in any form, or referred to in any other publication, without express written permission.